Grafana Labs Adds AI Watchers and Code-Fixing Agents to Its Observability Platform
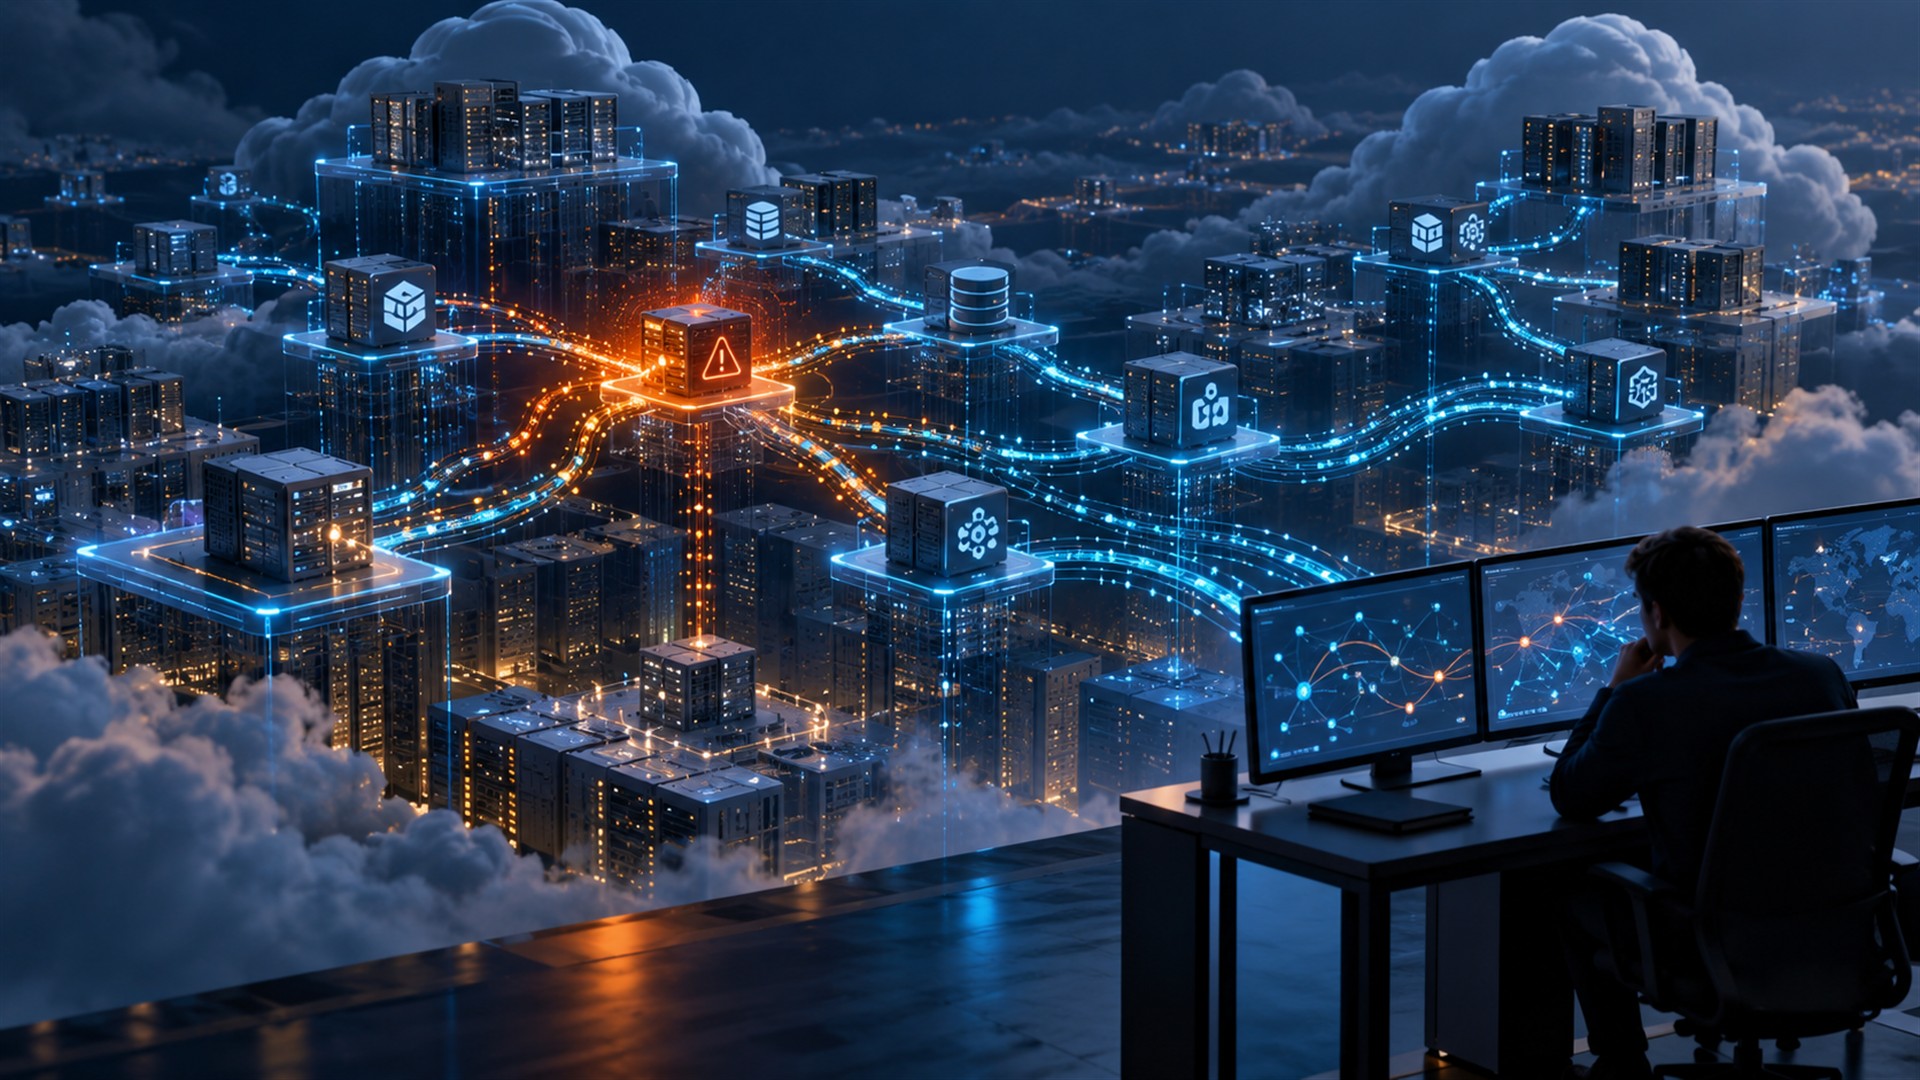
Grafana Labs is expanding Grafana Cloud with AI agents that watch for emerging problems, tools that prepare code fixes for human review, and a shared knowledge graph connecting infrastructure failures to the users they affect. Announced at ObservabilityCON 2026, the releases address two increasingly connected jobs: using AI to operate software and monitoring the AI systems entering production.
The rollout combines generally available capabilities with public and private previews. Assistant Watchers and Agent Observability with OpenTelemetry support are generally available, while Grafana Managed Sandboxes enters public preview. Alongside them, Grafana is introducing faster log searches, additional telemetry cost controls, and a commercial plugin marketplace.
The underlying question is how far an operations team should let an agent go. Finding an unusual pattern, explaining a failure, and changing production code carry different consequences. Grafana’s announcement brings those steps closer together while retaining human approval for proposed code fixes.
Assistant Watchers lets teams describe what they want monitored in ordinary language. Rather than relying exclusively on a predefined threshold, a Watcher learns patterns from telemetry and surfaces evidence when those patterns change. Findings route through existing Grafana Alerting, and a critical finding can initiate a deeper investigation.
That extends Grafana Assistant, the company’s built-in agent for asking questions about operational data. Assistant Investigations, generally available since July, can perform longer investigations initiated by alerts or incidents. The new Watchers supply another starting point: an emerging change that a team may not yet have encoded as an alert rule.
Grafana Managed Sandboxes adds a controlled cloud environment where Assistant can examine repository code alongside live telemetry, prepare a proposed fix, and open a pull request. The public preview stops at a reviewable change for a person to approve. A plausible diagnosis and a working patch still need validation against the application’s requirements and deployment process.
This matters because an agent can produce a convincing explanation without having enough evidence. Connecting each finding to telemetry gives engineers something to inspect, while a pull request creates a familiar checkpoint for reviewing the actual change.
The other half of the announcement concerns AI workloads already running inside applications. Agent Observability’s generally available OpenTelemetry support brings agent activity into the same open instrumentation standard used for other services.
Grafana’s Agent Observability product documentation describes conversation replay across prompts, tool calls, and responses, along with latency, token consumption, model costs, evaluations, and experiments. That can help teams distinguish an expensive model call from a slow downstream service, or investigate a quality regression after a prompt or tool changes.
Infrastructure health and answer quality require different measurements. A service can remain available while an agent uses the wrong tool or returns a poor response. Combining operational telemetry with evaluations broadens what engineers can investigate; it does not make every quality judgment automatic.
Grafana is also placing a Knowledge Graph in every Grafana Cloud stack. The runtime context layer links applications, databases, cloud services, Kubernetes infrastructure, and user-facing telemetry. Teams can add custom entities and relationships to represent the products or business systems that matter to them.
Custom entities and runtime context for agents are generally available. A new Cypher query capability allows agents to retrieve relationships from the graph, and Grafana says that context is accessible to Assistant and agents connected through gcx. The point is to reuse an established view of dependencies instead of reconstructing it from raw logs during every investigation.
Grafana’s existing Cloud MCP server documentation provides useful context for its approach to external agents. The hosted server lets compatible clients query Grafana data using OAuth authorization, with access limited by the user’s Grafana permissions. Sharing operational context across tools therefore also depends on the permissions and boundaries configured around that data.
Several extensions remain previews. A service catalog with ownership, Mobile Observability, Critical User Journeys, and Operational Context with Knowledge Graph are in private preview. Session Replay and Grafana Workflows are in public preview. Response Console, which brings human responders and agents into a common incident workspace, is in private preview.
These distinctions matter for adoption. A team can build on generally available graph capabilities now, but should assess preview access and maturity separately before depending on the broader incident-response workflow.
Agents generate a